


EQL Projects
Pilot Study: Withers Swash
Read the Planning Assistance to States (PAS) Report Documents
Tracking Fecal Pollution Links
This project was initiated two years ago as a U.S. Army Corps of Engineers (USACOE) Planning Assistance to States project, funded and conducted collaboratively by the USACOE-SC District, Horry County, Georgetown County and the cities of Myrtle Beach and North Myrtle Beach.
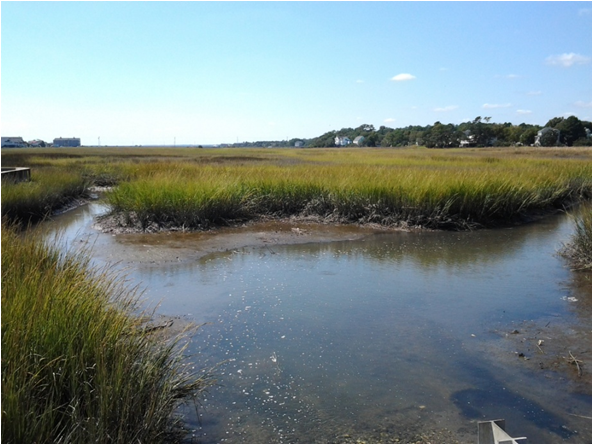
Withers Swash is one of 14 tidal creeks located along the Grand Strand. Most of these tidal creeks are on the federal 303(d) list of impaired water bodies for recreational usage due to contraventions of Enterococcus water quality standards (SC DHEC 2010).
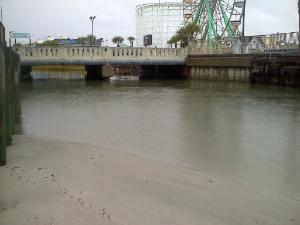 |
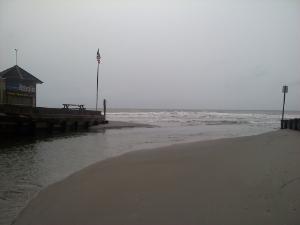 |
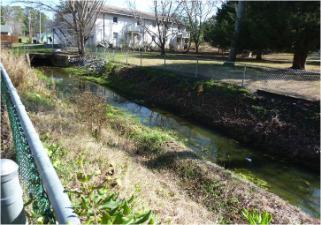
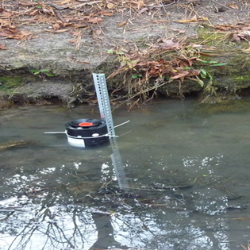
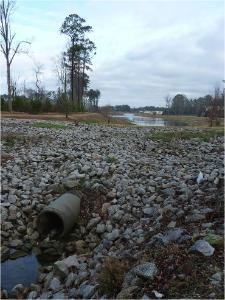
| Withers Swash, looking upstream. | Withers Swash, looking downstream. |
The Withers Swash sub-watershed in Myrtle Beach, SC, was chosen as the location of our pilot study after project partners:
- reviewed long-term monitoring data and determined that Withers Swash was highly contaminated with FIB
- conducted a sanitary survey of the Withers Swash watershed
- intensively sampled waters in the Withers Swash watershed
- executed an infrared thermography study of the area
The next step in determining the source of FIB in Withers Swash was to implement a microbial source tracking project using a weight of evidence approach.
Methods
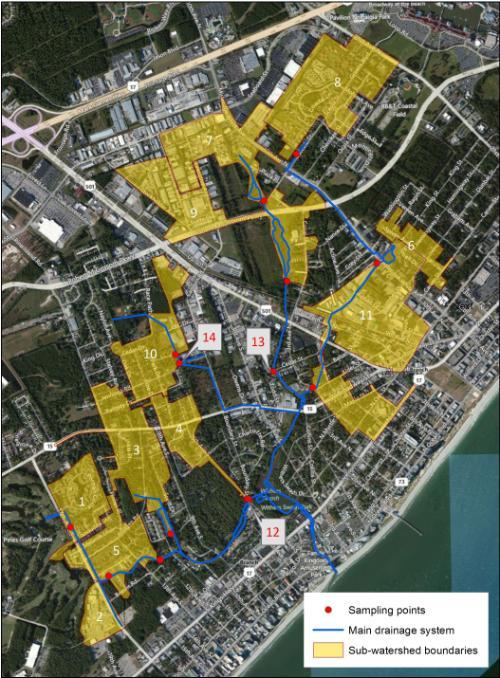
Working with the City of Myrtle Beach, we chose sites representing distinct drainage areas within the larger Withers Swash drainage basin that were likely to exhibit high instances of bacterial contamination and represent a diversity of land uses. Stormwater maps in a Geographic Information System (GIS) were used to delineate sub-watersheds based on stormwater patterns and a detailed knowledge of the sites.
 |
|
Map of our 14 sites within the Withers Swash watershed. Sites 12, 13, and 14 were check sites so their sub-watersheds were not delineated. |
We collected samples between April and September 2012, because FIB are known to be more active during warmer months. At each site, we collected samples during two dry and three wet weather events. We collected both dry and wet weather samples so that baseline and runoff-influenced water quality conditions could be compared. In order to sample the most contaminated water at each site, we focused our wet weather sampling on capturing the first flush (rising limb of the hydrograph) of each rain event at each site.
 |
 |
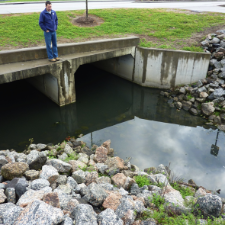
| Site 6 | Site 5 |
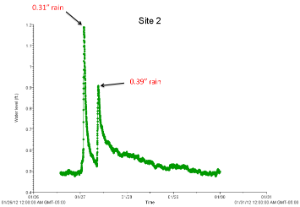
To capture the first flush, we deployed HOBO water level loggers at each site during a rain event before the start of sampling and took note of the "flashiness" (speed with which the water level rose and drained) of each site.
 |
 |
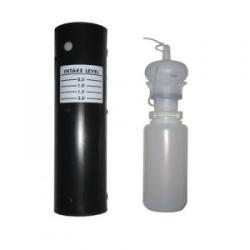
| HOBO water level logger | Deploying a HOBO water level logger |
 |
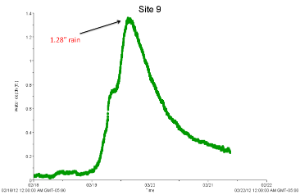 |
| Highly flashy site | Less flashy site |
We deployed two Nalgene first flush samplers at each site that exhibitied a highly “flashy” hydrograph. They were deployed at different heights in the water column in order to sample water at different points during the rising limb of the hydrograph. The water collected by the two first flush samplers at each site was then composited and sub-sampled for all laboratory analyses.
 |
 |
| First flush sampler | First flush sampler deployed in storm ditch. |
We also used the HOBO water level data to determine that approximately 0.25 inches of rain were needed during a single rain event in order to generate the runoff needed for our sampling. We decided that both wet and dry weather sampling would require 72 hours of antecedent dry weather conditions (USEPA 1992).
All water samples were collected at a depth of 0.3 m. In each water sample we analyzed:
- Bacteriodes thetaiotamicron (GenBac)

- Bacteriodes dorei (BacHum)
- Bacteriodes canine (BacCan)
- five-day biological oxygen demand (BOD5)
- turbidity
- ammonia-nitrogen (NH3)
- total suspended solids (TSS)
- volatile suspended solids (VSS)
- toxicity
- E. coli
- total coliforms
- Enterococci
- salinity
- optical brighteners
At the time of sample collection, in situ measurements were also made for pH, temperature, and dissolved oxygen (DO) at each sampling location.
You can learn more about our project methods in our Quality Assurance Project Plan.
Looking Ahead
Our genotypic tracking tools and sub-watershed investigatory protocol are now available for application throughout Horry and Georgetown counties to address microbial source tracking needs at known sites of FIB impairments.
|
|
We are currently in the middle of a similar project in Murrells Inlet, SC. You can read more about it in a 2/8/13 article, It's CSI Murrells Inlet in Search for Source of Bacteria, from the Coastal Observer.
 |