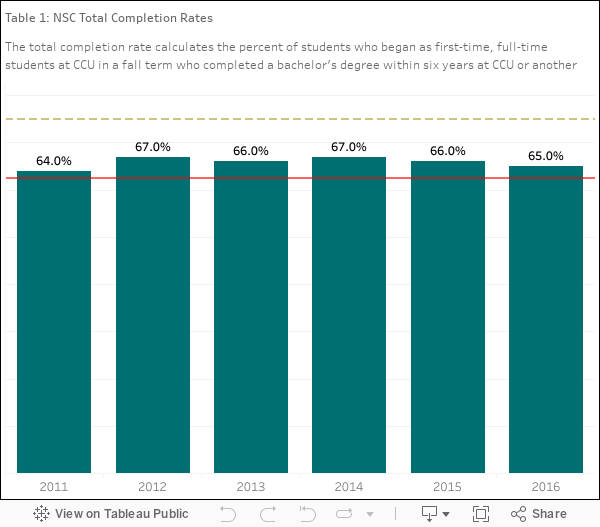
National Student Clearinghouse (NSC) Completion Rates
The NSC total completion rate counts all students who enter for the first time at any four-year institution and complete their coursework at any U.S. degree-granting institution within six years. Including students who transfer to another institution allows institutions to account for the various pathways to success. Table 1 shows the NSC total completion rates for the first-time, full-time Fall 2011 to Fall 2016 students.
Goal: 75.5%
Threshold of Acceptability: 62.5%
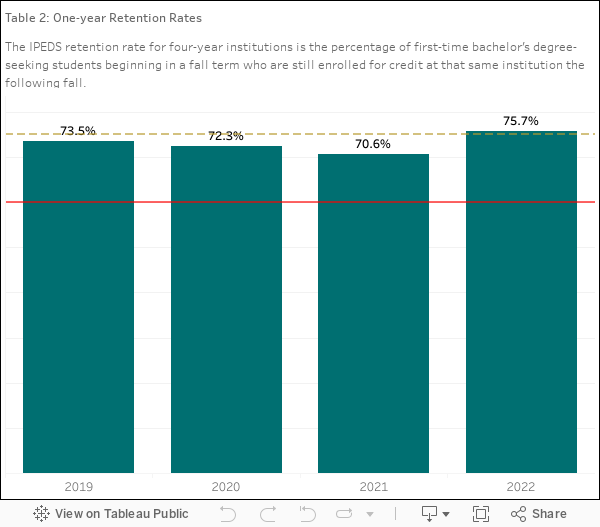
One-year Retention Rates
The University annually reports on a number of student persistence factors, including one-year retention rates. First-time, full-time student one-year retention rates are indicators of important characteristics of the University experience such as instruction, advisement, student services, campus life, and environment. Table 2 identifies one-year retention rates for the Fall 2018 to Fall 2021 first-time, full-time student cohorts.
Goal: 75.0%
Threshold of Acceptability: 60.0%
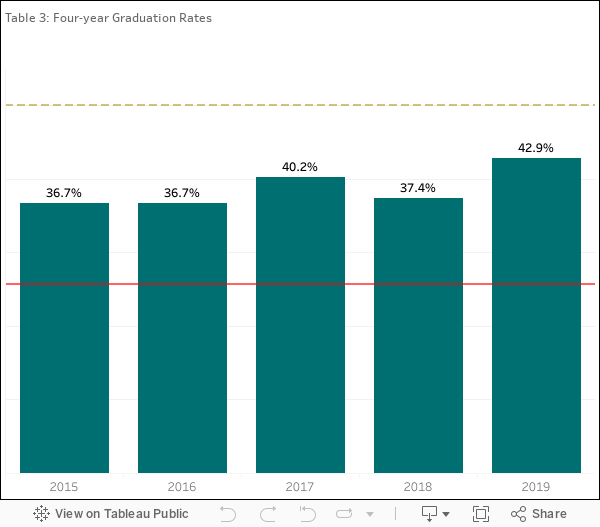
Four-year Graduation Rates
Four-year graduation rates are the percentage of first-time, full-time degree-seeking undergraduate students who completed a bachelors degree within four years, based on the IPEDS definition. Table 3 identifies four-year graduation rates for the Fall 2015 to Fall 2019 first-time, full-time student cohorts.
Goal: 50.0%
Threshold of Acceptability: 25.7%
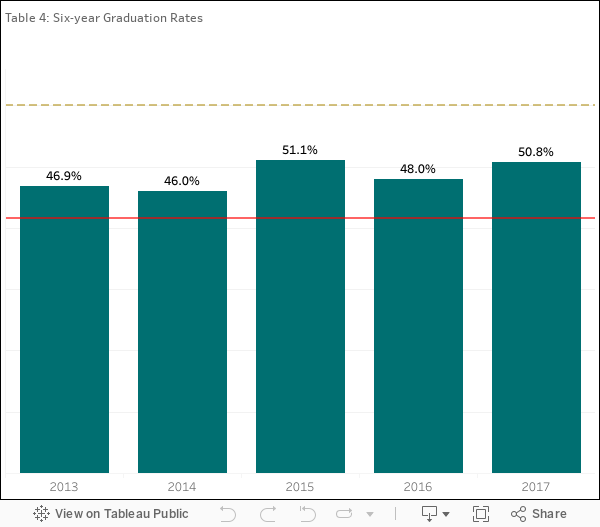
Six-year Graduation Rates
Six-year graduation rates are the percentage of first-time, full-time degree-seeking undergraduate students who completed a bachelors degree within six years, based on the IPEDS definition. Table 4 identifies six-year graduation rates for the Fall 2013 to Fall 2017 first-time, full-time student cohorts.
Goal: 60.0%
Threshold of Acceptability: 41.7%
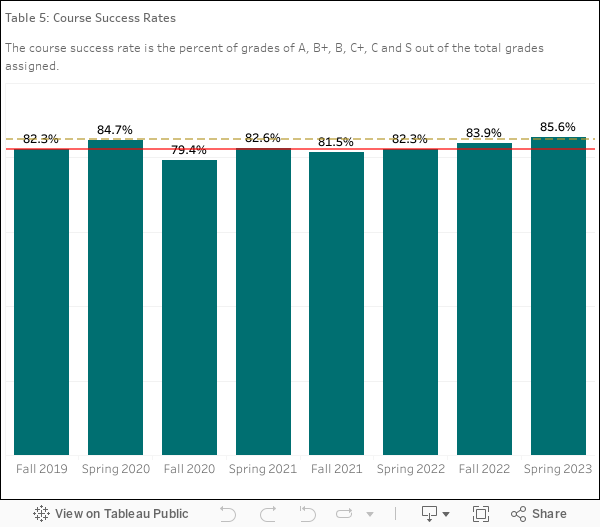
Course Success Rates
The course success rate is the percent of grades of A, B+, B, C+, C and S out of the total grades assigned in undergraduate courses. Table 5 identifies course success rates for the Fall 2019 to Spring 2023 terms.
Goal: 85.0%
Threshold of Acceptability: 82.2%
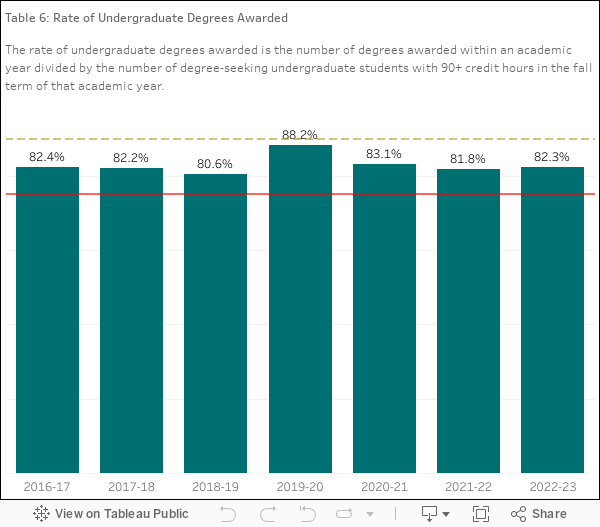
Rate of Undergraduate Degrees Awarded
The rate of undergraduate degrees awarded is the number of undergraduate degrees awarded in an academic year divided by the number of undergraduate degree-seeking students with 90 or more cumulative credit hours enrolled in the fall term of that academic year. An increase in the number of undergraduate degrees awarded alone does not provide evidence of student success; enrollment data (particularly, the enrollment of students who are within a year of graduating) is needed to show whether the University is successfully awarding more degrees with respect to the number of students who should be receiving a degree. Table 6 shows the rate of undergraduate degrees awarded in academic years 2016-2022.
Goal: 90.0%
Threshold of Acceptability: 75.0%
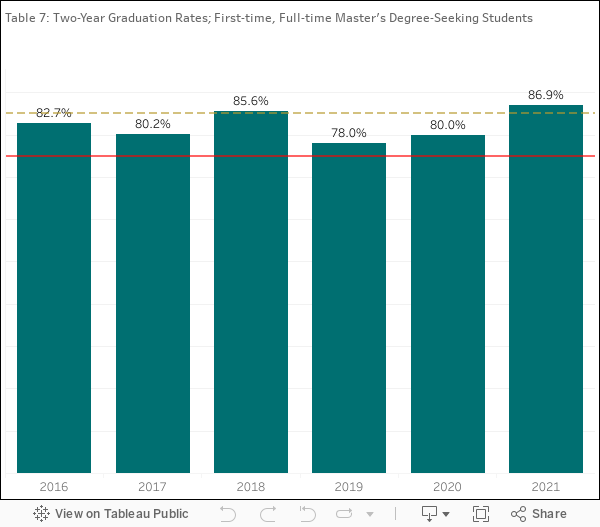
Two-year Graduation Rates of First-time, Full-time Master's Degree-Seeking Students
Two-year graduation rates are the percentage of first-time, full-time Master's degree-seeking students who completed a Master's degree within two years. Table 7 identifies two-year graduation rates for the Fall 2016 to Fall 2021 first-time, full-time Master's degree-seeking student cohorts.
Goal: 85.0%
Threshold of Acceptability: 70.0%
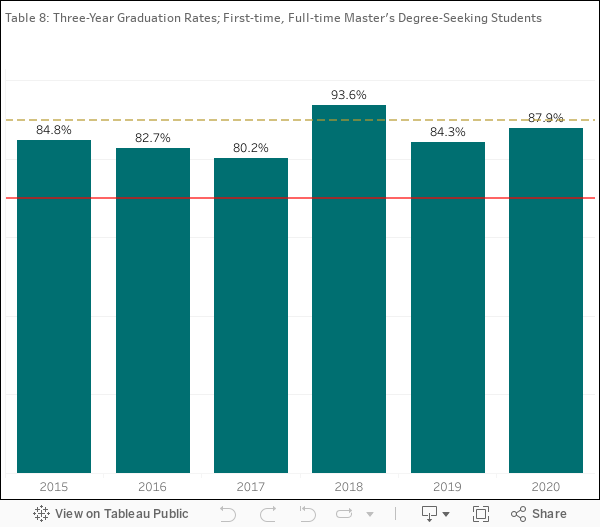
Three-year Graduation Rates of First-time, Full-time Master's Degree-Seeking Students
Three-year graduation rates are the percentage of first-time, full-time Master's degree-seeking students who completed a Master's degree within three years. Table 8 identifies three-year graduation rates for the Fall 2015 to Fall 2020 first-time, full-time Master's degree-seeking student cohorts
Goal: 90.0%
Threshold of Acceptability: 70.0%